
You were hired to find the next €50,000. Not to rebuild last night's model.
Revenue managers spend less than half their week on revenue-generating work. HSMAI measured it at 49%. You did not study price elasticity to reformat the same pick-up report for three audiences.
HSMAI / ZS, Voice of the Revenue Manager study (145 North American revenue managers, 1,732 properties).
Our entire team now works out of one place with the same data, and our use of Excel has dropped by around 95%. We went from reactive firefighting to proactive control.

Director of Revenue Management & Distribution
Classic Norway Hotels
You didn’t become a revenue manager to copy and paste data.
Look at where the week actually goes. The work you trained for sits underneath a pile of collection, formatting, and error-checking that no one else sees.
HSMAI measured 49% of revenue-manager time on revenue-generating work and 13% on updating systems. At a Demand Calendar customer, automated collection freed roughly 4,800 manual hours a year across the portfolio.
Your analysis stays yours. It stops being invisible.
The hard part of the job is rarely the math. The hard part is getting a room full of people to act on what your numbers already prove, and carrying the blame when they do not.
Your analysis, made undeniable
You spend up to a third of your week convincing colleagues to accept what your analysis already proved. HSMAI put internal persuasion at 30% of the role.
When the GM and the sales director look at the same forecast on the same screen, the argument ends before it starts. The data speaks Together, so you stop speaking for it alone.
On the record, before the month turns
When RevPAR climbs, the market did it. When it drops, the question is "what happened to the forecast?" You carry the accountability without the authority.
A shared forecast keeps a visible history. The record shows you flagged the softening on the 4th. You stop keeping private receipts to protect yourself.
Your model deserves better than a .xlsx file
Your spreadsheet holds a decade of market judgment encoded in formulas. It also sits one corrupted file away from not existing, and it cannot take a vacation with you.
Demand Calendar gives that judgment better infrastructure. The judgment stays. The fragility leaves. Alexander Killi cut his Excel use by around 95%, his words and his choice.
One coherent view of the whole hotel
You log in and out of many systems before your first coffee, then hold the full picture in your head because no tool holds it for you.
Your Excel is not the problem. It is the symptom of a stack that never gave you one place to think. Demand Calendar becomes that place.
Keep every detail. Reach the ones Excel cannot hold.
A common worry: \"I will lose the detail I have in my sheet.\" The opposite happens. You get the total overview and a drill-down to the smallest line, past the point a spreadsheet can go, because the platform holds the raw data your Excel only summarizes.
Only one thing
- Manual data extraction: the five-report Monday, the re-keying into templates, the model rebuild at 7pm.
Depth, and the next move
- A drill-down to the smallest detail, deeper than a spreadsheet can show.
- The numbers your sheet never reached, because they live in other systems.
- Clear read on which action to take next, not just a record of what already happened.
One forecast. One weekly decision. The whole team works from your numbers.
The forecast becomes the operating rhythm of the hotel. You run it. You do not present it and hope no one asks for a different view. You answer the owner's question on the spot, because the answer is already on the screen.
Move Beyond RevPAR. Read total profit.
Total Revenue Management
TRevPAR
RevPAR shows occupancy. TRevPAR shows how valuable the guest is: total revenue per available room.
Calculated every day, so you catch spending trends that standard RMS tools never surface.
NetRevPAR & Acquisition Costs
Revenue is vanity. NetRevPAR nets out OTA commission, transaction fees, and marketing spend.
Read true channel profit in real time and shift toward high-margin direct bookings before the month closes.
Dynamic Forecasting
Move from a static monthly budget to a rolling forecast that adapts as the market moves.
The forecast stays alive after you hit save, so you protect flow-through rather than chase it.
The numbers that change your decisions live in other people's systems.
You built a model that works, and it holds what your PMS gives you. The data that moves the next decision now sits with Sales, Marketing, and Finance. No spreadsheet reaches across all of them. Demand Calendar does. Here are six answers your Excel cannot give you today.
See the sales pipeline the moment it changes, not at month-end when the rooms are already committed.
Live pipeline accessWatch marketing campaign pick-up as it lands, so you separate the demand you paid for from the demand you would have won anyway.
Live campaign pick-upRead the drivers behind the pick-up across six variables, not just the total on the last line of a report.
6 pick-up driversSee the pick-up you can expect across six variables, so you set rates against what is coming, not what already came.
6 forecast variablesCustomer acquisition cost across ten variables, calculated on autopilot, so channel profit stops being a month-end guess.
CAC across 10 variablesRun the profit displacement for any group before you answer, so you price the group against the transient revenue it pushes out.
Profit displacementWill AI replace revenue managers?
Automation removes the part of your week a junior could do: the collection, the formatting, the model rebuild at 7pm. What remains is the part no tool can do. Judgment. Market knowledge. The call nobody else dares to make. Strong revenue managers get more visible with better tools, not less.
Rooms
Own the room revenue forecast, clean and automated.
Total
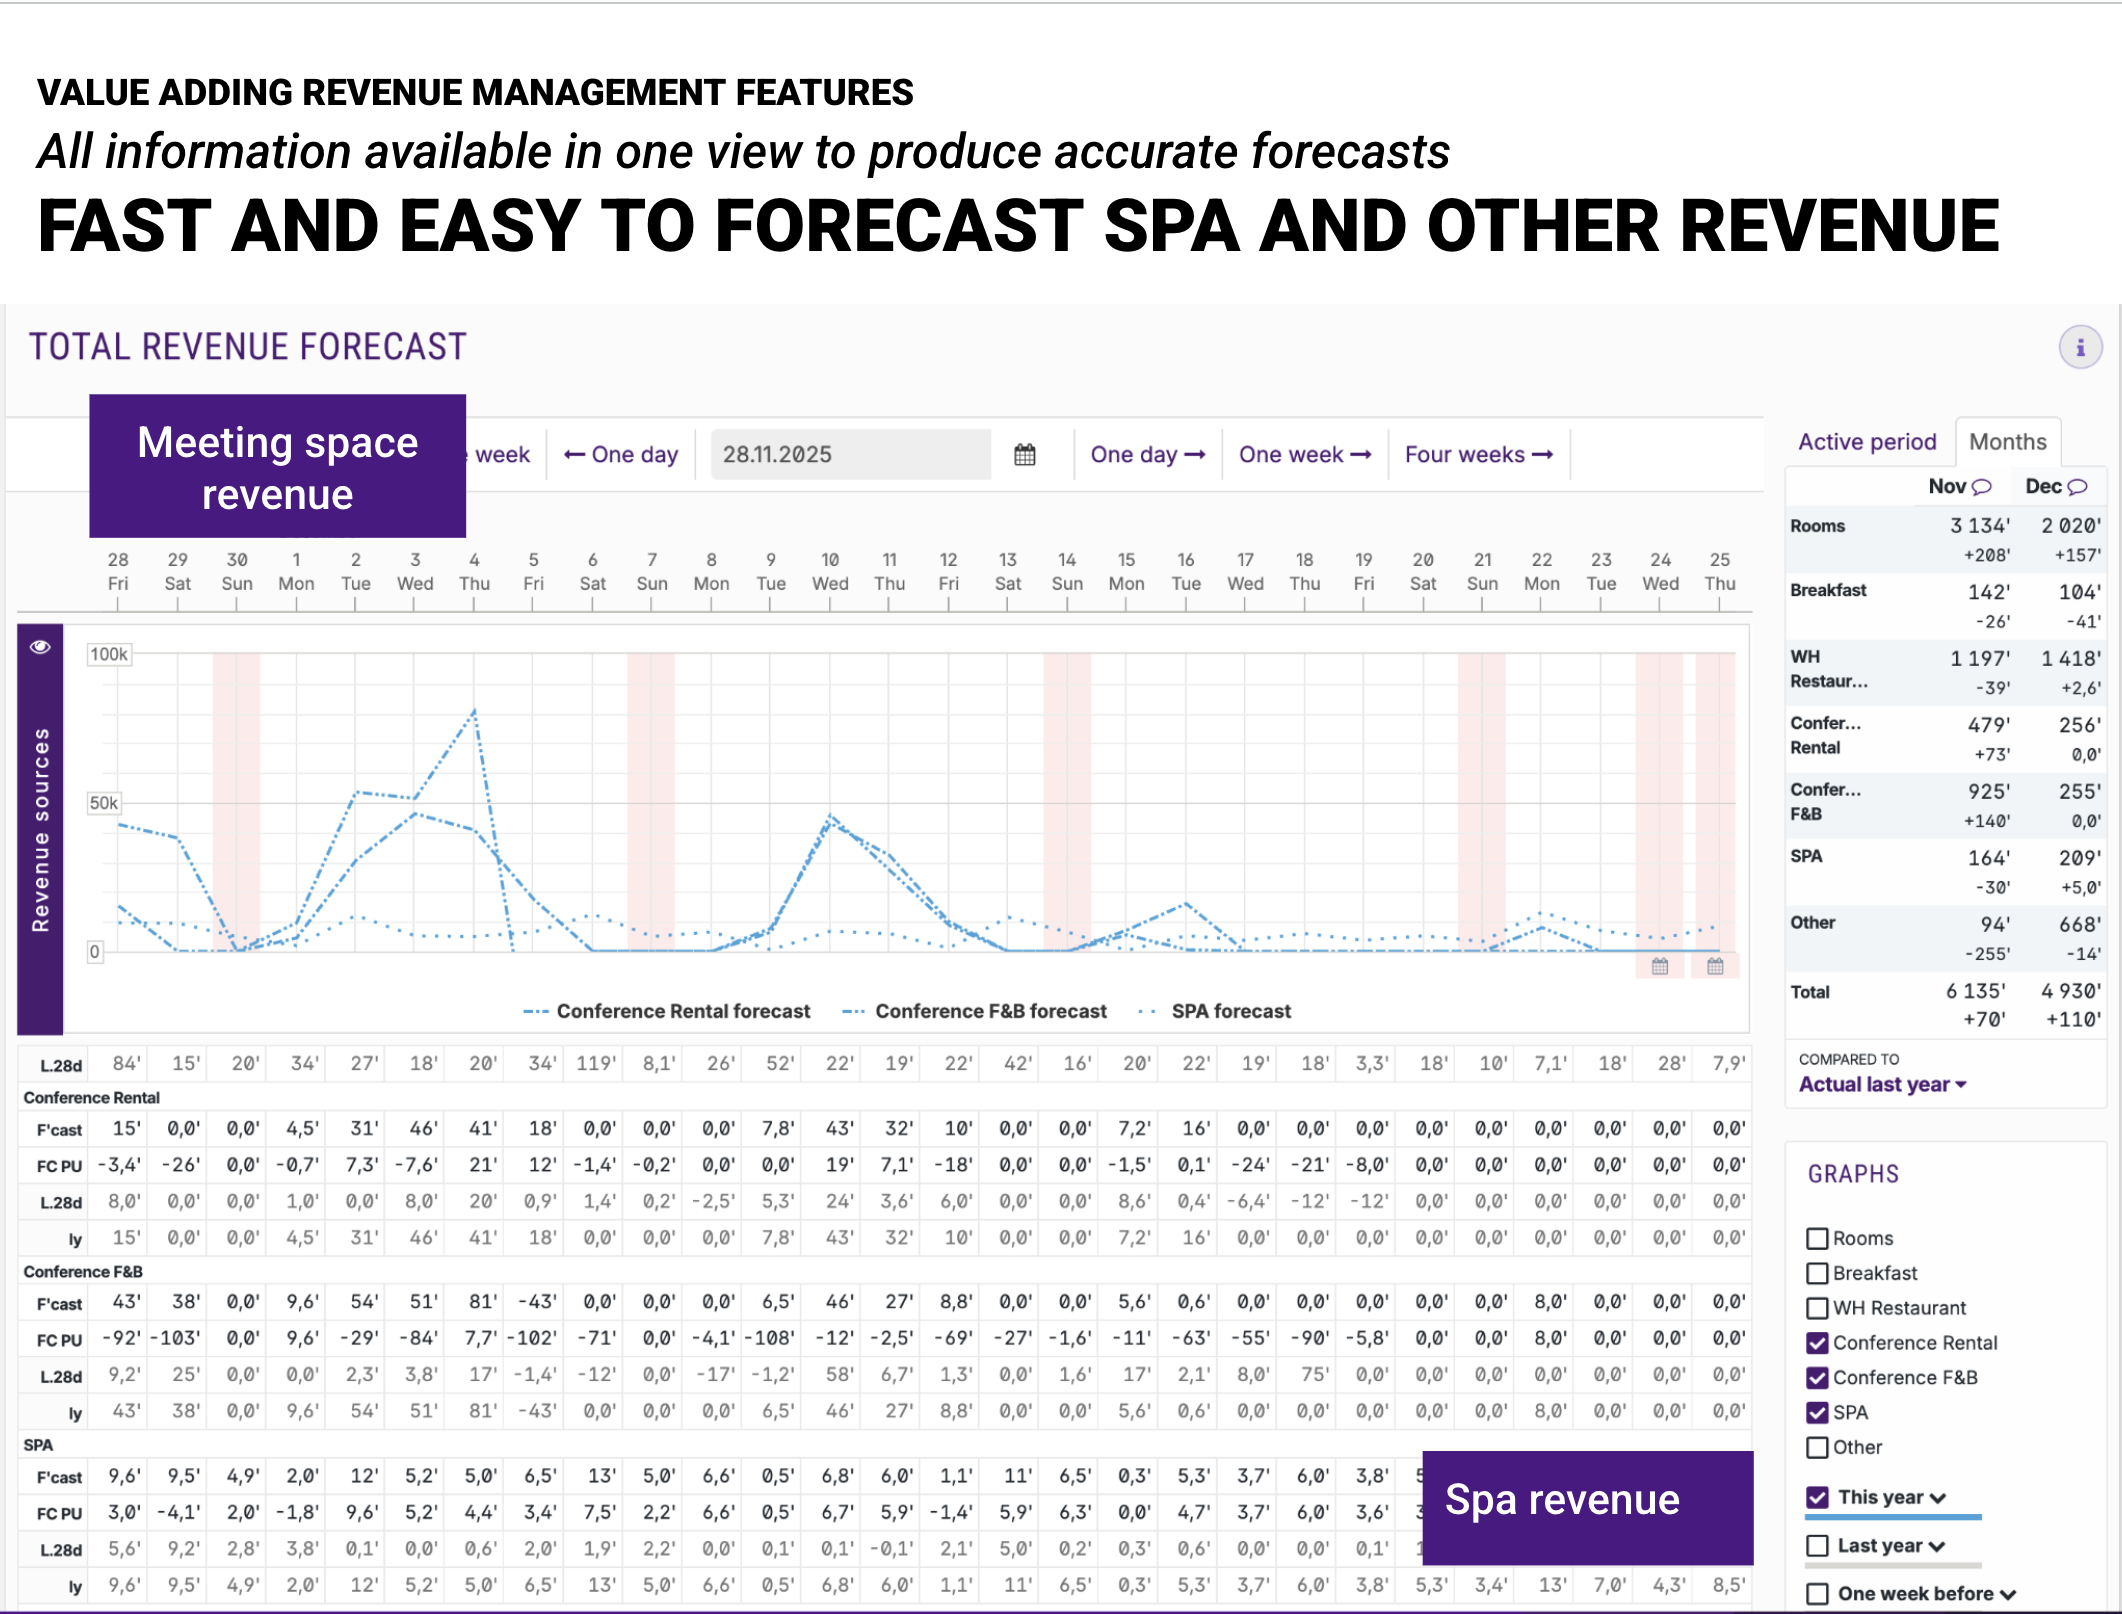
Add F&B, meetings, and spa. Forecast the whole revenue picture.
Profit
Add acquisition cost and flow-through. Forecast profit, not just revenue.
The revenue manager who runs the total revenue and profit forecast is the natural next commercial director. Demand Calendar is the ladder.
Make the case to your GM without translating it yourself.
The GM business case states the value in your GM's language: the profit story, the ROI, the one-page summary. You bring the case. The numbers do the arguing.
- The profit and payback math for a property your size
- The 48-hour diagnostic built on your own room count, ADR, and F&B mix
- The one-page GM summary, money-first, ready to forward
The questions you are actually asking
No. Demand Calendar removes the janitorial half of the week, the collection and formatting a junior could do. It does not remove judgment, market knowledge, or the strategic call, which is the half only you can do. Weak analysis gets exposed by better tools. Strong revenue managers get more visible.
Demand Calendar builds a direct, automated connection to your PMS. Reservations, revenue, and corporate production sync every day, so you reach zero manual entry and a single set of numbers that match your PMS. Standard integrations cover Opera Cloud, Mews, Clock, and other cloud systems.
